


Elegant UX
Good web design requires time to explore and resources to invest. With the help of heat maps, it will be easier to pinpoint portions or elements that are affecting your design badly. Optimize your web design for focused, powerful and lead-generating web pages.

Site Testing
Anything that can be measured, can be improved. Site testing is important to maintain website functionality at an optimum level. Heat maps test website’s navigation and point out the weak locations. With heat map visual results, you can understand what design feature or portion is depleting your sales funnel.

Second Sight
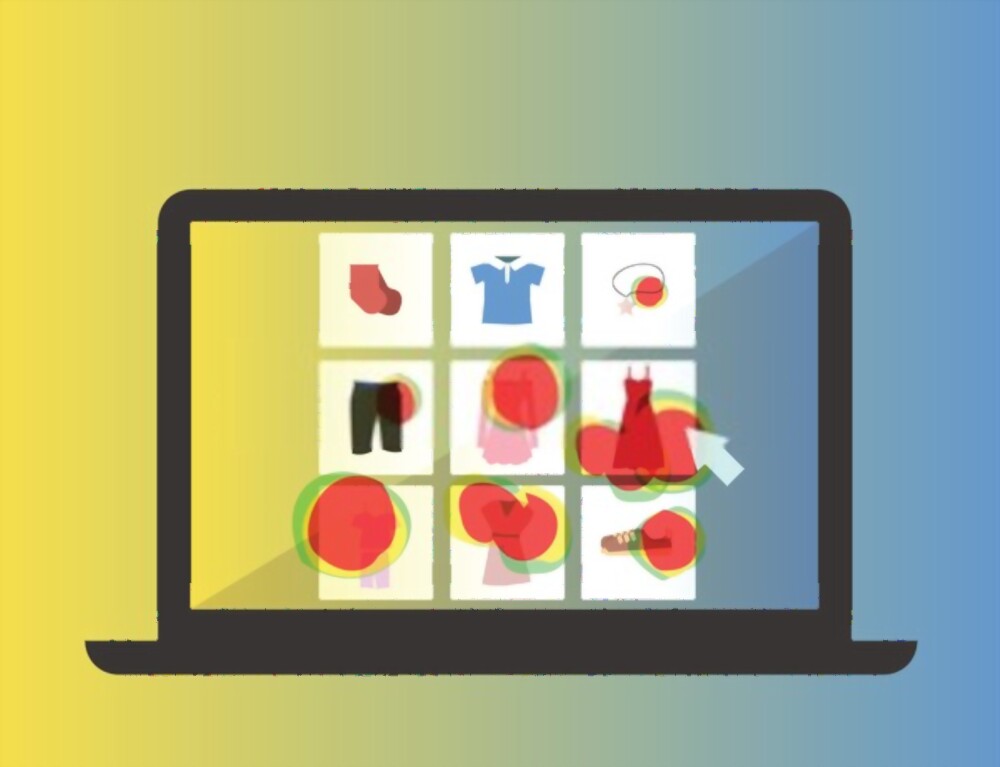
Heat maps generally show how visitors explore a website. Getting information about visitors’ perspectives makes it easier to amend website functions and elements in a mind-captivating way. Get a real-time picture of your website with heat maps. Understand visitors’ needs and recast your website accordingly.

SEO Insights
Heat maps show data in visual form rather than text and numbers. These insights assist to better understand web infrastructure for optimization points. Junction of heat maps and other analytics tools’ readings are the best match for incontrovertible insights. Understand visitors’ needs, follow the latest trends and make the most from market with heat mapping insights.